Get home early with RoadWarrior.
Enter your stops, optimize your routes, manage your team – quickly and efficiently.
Try RoadWarrior free for 7 days
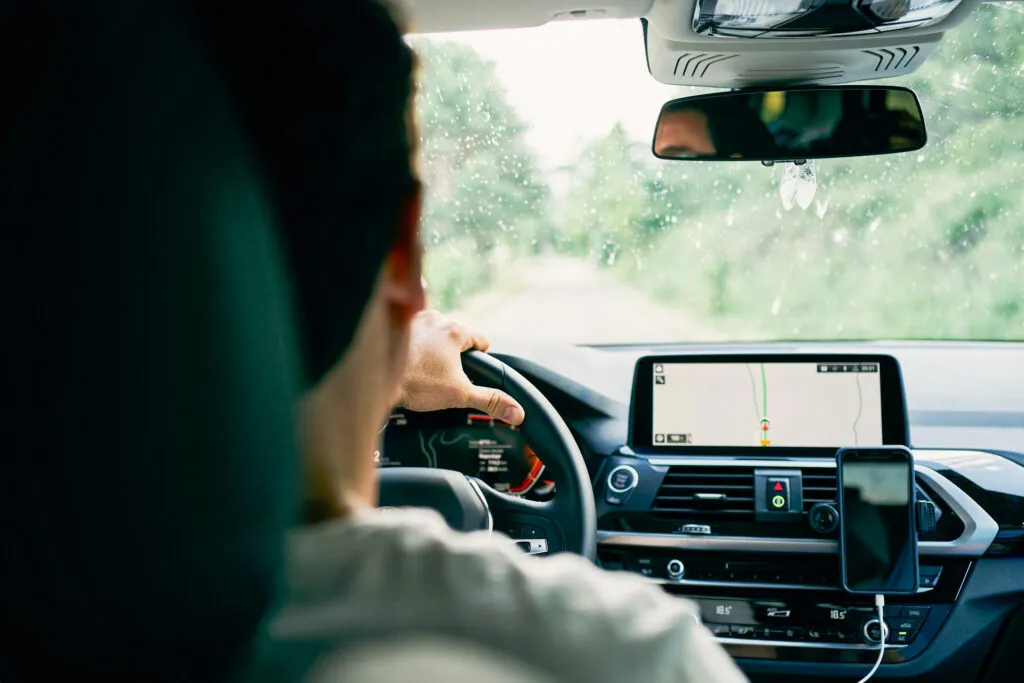
Try free for 7 daysIf you live in or near a major city and drive a car, you can’t do much these days to avoid traffic. But what makes driving in some cities worse than others, or one road more congested than another?
Well, according to INRIX, a company that analyzes traffic and infrastructure data, it’s “traffic hotspots.” They define traffic hotspots as “traffic jams that occur at the same locations along a stretch of road.” According to Mark Burfiend, the director of public relations at INRIX, a key element that defines a traffic hotspot is that they are reliable and predictable. If a commuter travels along the same route at the same time every day, and it’s always backed up at the same intersection or merge point, that is a traffic hotspot.
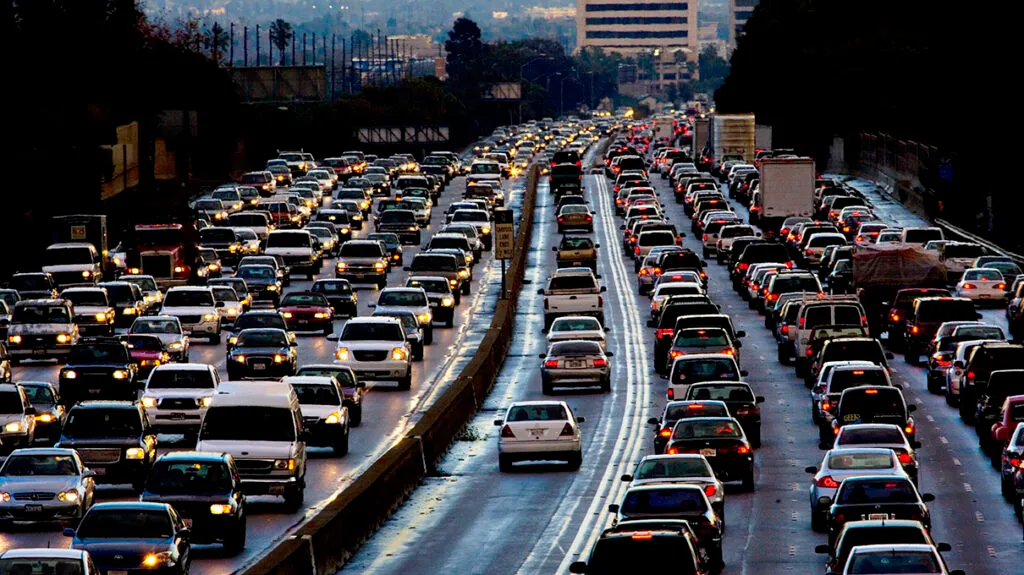
A recent study by INRIX released in September 2017 named and ranked the worst traffic hotspots in the U.S. — 108,000 in the 25 most congested U.S. cities. L.A., New York, D.C., Atlanta and Dallas rounded out the top five with most.
INRIX conducted the study to learn more about the U.S. transportation network and “the health of the road.” The results will be used to help determine the best and most efficient ways to allocate money toward the country’s transportation infrastructure. In other words, by identifying the worst traffic hotspots — and how they work — public officials can make upgrades in the areas that will have the most benefit to drivers.
How it Works
For the purposes of the study, INRIX used its cloud-based traffic analysis tool Roadway Analytics to analyze areas with frequent traffic jams, and further narrowed those down to spots where speeds were typically observed to drop below 65 percent of reference [uncongested] speed for at least two minutes. In other words, in a hotspot, traffic will slow to less than half its usual pace. The study also looked at the economic costs in terms of wasted time, lost fuel and carbon emissions over the next decade.
Using the data it gathered, INRIX created a Global Traffic Scorecard, which ranks the cities with the worst traffic and identifies the time and money wasted in traffic congestion. The Global Traffic Scorecard rates cities on a metric called the Impact Factor, which is calculated by duration X length X number of traffic jams.
Here are some other insights from the study:
- The cities at the top of the Global Traffic Scorecard are Los Angeles, New York, San Francisco, Atlanta and Miami
- Though New York has more traffic hotspots than any other city in the study, drivers in Los Angeles pay more due to hotspots
- There were more than 128,000 traffic jams in Los Angeles during March and April of 2017
- The worst single hotspot in the country is near Fredericksburg, Virginia, on Interstate 95 South at Exit 133A, and is estimated to cost drivers there $2.3 billion through 2026
- A traffic jam in this I-95 hotspot lasts 33 minutes, on average, and stretches about 6.47 miles (10.41 kilometers)
The report concluded that across all 25 cities studied, traffic hotspots will cost drivers $480 billion during the next 10 years in lost time, wasted fuel and carbon emitted. When extrapolated across the country as a whole, the cost of hotspots is expected to reach $2.2 trillion — with a T — through 2026.
Using Data to Improve Traffic
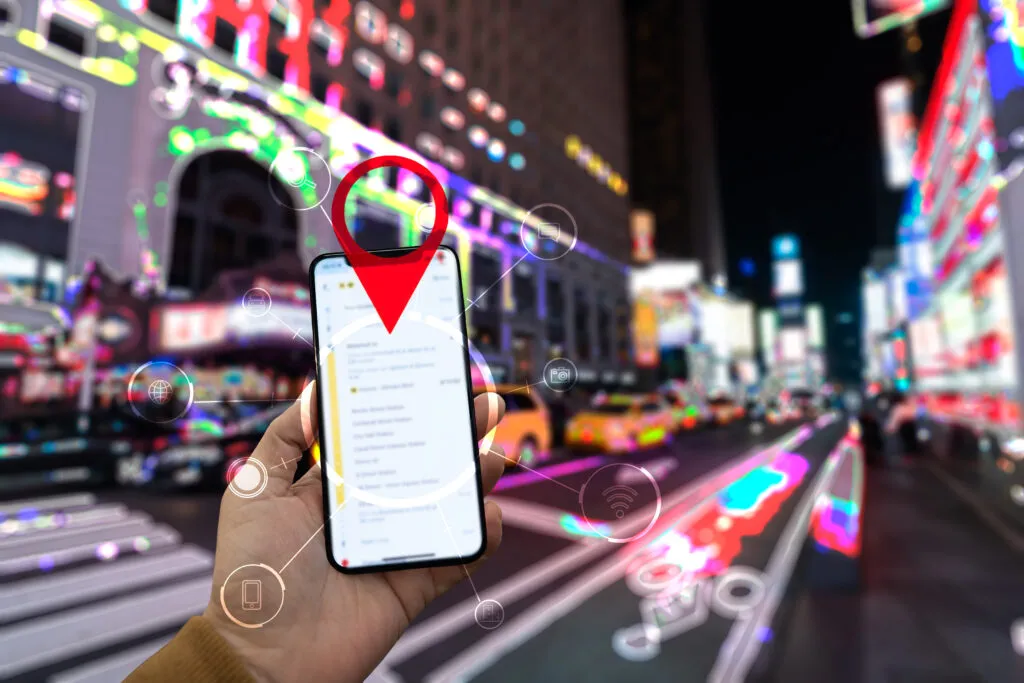
Connected cars and mobile devices are the key to this study, since they can be tracked by GPS. For example, if you’re using a smartphone for traffic monitoring, researchers can tell when and where you speed up, slow down and come to a stop. INRIX is not the only company that takes advantage of our connectivity. For example, if you use Google Maps to calculate a route and get travel time estimates, those estimates are also courtesy of real-time GPS analytics.
In addition to the tangible effects, hotspots contribute to hard-to-measure problems, such as a city’s overall reputation for being a difficult or expensive place to live, work or visit. After all, no one wants to vacation in a city where they will spend most of the time in bumper-to-bumper traffic. That means this data is extremely useful to cities that are trying to improve the roadway system.
For example, Chicago recently implemented strategies to ease congestion along I-90, which improved rush hour travel times by 64 percent for westbound commuters. A new lane was added on each side of the expressway; buses and emergency vehicles are authorized to use the shoulder lane; and real-time traffic data (again, gathered from GPS-enabled cars and mobile devices) is provided to commuters. California, New Jersey and Washington are among states that have recently passed legislation to authorize funding for infrastructure upgrades.
The goal, presumably, is to pave the way for smoother traffic when (or if) autonomous cars become the norm, but there is no reason that American drivers shouldn’t benefit from this technology now. The cloud isn’t just for streaming music anymore.
Now That’s Interesting
According to the U.S. Department of Transportation, drivers in the United States are expected to drive a cumulative of 2,147.8 billion vehicle miles of travel by then end of 2017.
Content written by Cherise Threewitt and created in partnership with HowStuffWorks.com